概述
Prometheus是一個開源的服務監控系統�����,它通過HTTP協議從遠程的機器收集數據并存儲在本地的時序數據庫上��。它提供了一個簡單的網頁界面、一個功能強大的查詢語言以及HTTP接口等等�����。Prometheus通過安裝在遠程機器上的exporter來收集監控數據����,這里用到了以下兩個exporter:
- node_exporter – 用于機器系統數據
- mysqld_exporter – 用于Mysql服務器數據
Grafana是一個開源的功能豐富的數據可視化平臺�����,通常用于時序數據的可視化��。它內置了以下數據源的支持:
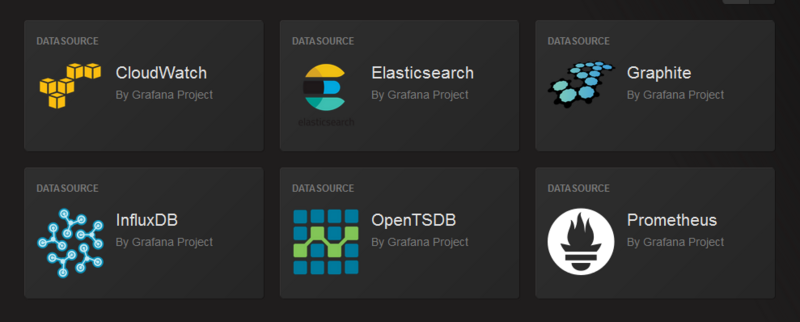
并可以通過插件擴展支持的數據源����。
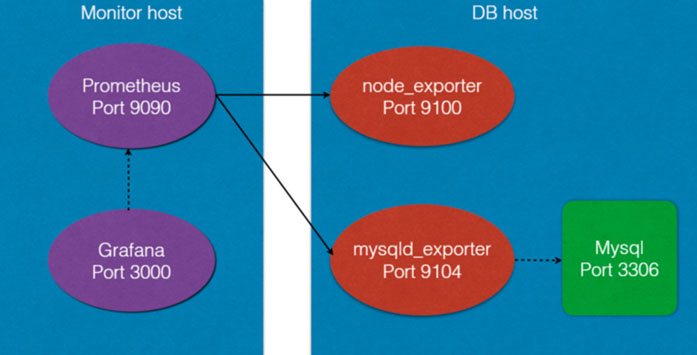
架構圖
下面是本次部署的架構圖
安裝并運行Prometheus
1.在 Monitor 上安裝 Prometheus
安裝至/opt/prometheus
$ wget https://github.com/prometheus/prometheus/releases/download/v1.5.2/prometheus-1.5.2.linux-amd64.tar.gz
$ tar zxvf prometheus-1.5.2.linux-amd64.tar.gz
$ mv prometheus-1.5.2.linux-amd64 /opt/prometheus
2.在安裝目下編輯配置文件 prometheus.yml
vim /opt/prometheus/prometheus.yml
# my global config
global:
 scrape_interval: 15s # Set the scrape interval to every 15 seconds. Default is every 1 minute.
 evaluation_interval: 15s # Evaluate rules every 15 seconds. The default is every 1 minute.
 # scrape_timeout is set to the global default (10s).
 # Attach these labels to any time series or alerts when communicating with
 # external systems (federation, remote storage, Alertmanager).
 external_labels:
 monitor: 'codelab-monitor'
# Load rules once and periodically evaluate them according to the global 'evaluation_interval'.
rule_files:
 # - "first.rules"
 # - "second.rules"
# A scrape configuration containing exactly one endpoint to scrape:
# Here it's Prometheus itself.
scrape_configs:
 # The job name is added as a label `job=job_name>` to any timeseries scraped from this config.
 - job_name: 'prometheus'
 # metrics_path defaults to '/metrics'
 # scheme defaults to 'http'.
 static_configs:
 - targets: ['localhost:9090']
 # 以下是添加的部分
 - job_name: linux
 static_configs:
 - targets: ['172.30.251.214:9100']
 labels:
 instance: db1
 - job_name: mysql
 static_configs:
 - targets: ['172.30.251.214:9104']
 labels:
 instance: db1
其中:172.30.251.214是MySQL的IP,端口則是對應的exporter的監聽端口����。
3.啟動Prometheus
[loya@centos6 prometheus]$ ./prometheus
INFO[0000] Starting prometheus (version=1.5.2, branch=master, revision=bd1182d29f462c39544f94cc822830e1c64cf55b) source=main.go:75
INFO[0000] Build context (go=go1.7.5, user=root@a8af9200f95d, date=20170210-14:41:22) source=main.go:76
INFO[0000] Loading configuration file prometheus.yml source=main.go:248
INFO[0000] Loading series map and head chunks... source=storage.go:373
INFO[0000] 0 series loaded. source=storage.go:378
INFO[0000] Starting target manager... source=targetmanager.go:61
INFO[0000] Listening on :9090 source=web.go:259
Prometheus內置了一個web界面,可以通過http://monitor_host:9090進行訪問:

在Status->Targets頁面下,可以看到我們配置的兩個Target��,它們的State為DOWN����。

4.接下來需要在被監控機器上安裝并運行exporter
下載exporters并解壓:
$ mkdir /opt/prometheus/prometheus_exporters
$ cd /opt/prometheus/prometheus_exporters
$ wget https://github.com/prometheus/node_exporter/releases/download/v0.14.0-rc.1/node_exporter-0.14.0-rc.1.linux-amd64.tar.gz
$ wget https://github.com/prometheus/mysqld_exporter/releases/download/v0.9.0/mysqld_exporter-0.9.0.linux-amd64.tar.gz
$ tar zxvf node_exporter-0.14.0-rc.1.linux-amd64.tar.gz
$ tar zxvf mysqld_exporter-0.9.0.linux-amd64.tar.gz
# 將各自的可執行文件移動到/opt/prometheus/prometheus_exporters
$ ll /opt/prometheus/prometheus_exporters
total 24464
-rwxr-xr-x 1 root root 12182376 Feb 23 19:01 mysqld_exporter
-rwxr-xr-x 1 root root 12862209 Feb 23 19:01 node_exporter
運行node_exporter
$ cd /opt/prometheus/prometheus_exporters
$ ./node_exporter
INFO[0000] Starting node_exporter (version=0.14.0-rc.1, branch=master, revision=5a07f4173d97fa0dd307db5bd3c2e6da26a4b16e) source="node_exporter.go:136"
INFO[0000] Build context (go=go1.7.4, user=root@ed143c8f2fcd, date=20170116-16:00:03) source="node_exporter.go:137"
INFO[0000] No directory specified, see --collector.textfile.directory source="textfile.go:57"
INFO[0000] Enabled collectors: source="node_exporter.go:156"
INFO[0000] - entropy source="node_exporter.go:158"
INFO[0000] - loadavg source="node_exporter.go:158"
INFO[0000] - stat source="node_exporter.go:158"
INFO[0000] - diskstats source="node_exporter.go:158"
INFO[0000] - textfile source="node_exporter.go:158"
INFO[0000] - vmstat source="node_exporter.go:158"
INFO[0000] - meminfo source="node_exporter.go:158"
INFO[0000] - filefd source="node_exporter.go:158"
INFO[0000] - filesystem source="node_exporter.go:158"
INFO[0000] - mdadm source="node_exporter.go:158"
INFO[0000] - netdev source="node_exporter.go:158"
INFO[0000] - sockstat source="node_exporter.go:158"
INFO[0000] - time source="node_exporter.go:158"
INFO[0000] - zfs source="node_exporter.go:158"
INFO[0000] - edac source="node_exporter.go:158"
INFO[0000] - hwmon source="node_exporter.go:158"
INFO[0000] - netstat source="node_exporter.go:158"
INFO[0000] - uname source="node_exporter.go:158"
INFO[0000] - conntrack source="node_exporter.go:158"
INFO[0000] Listening on :9100 source="node_exporter.go:176"
mysqld_exporter需要連接到MySQL����,所以需要MySQL權限,我們為其創建用戶并賦予所需的權限:
mysql> GRANT REPLICATION CLIENT, PROCESS ON *.* TO 'prom'@'localhost' identified by 'abc123';
mysql> GRANT SELECT ON performance_schema.* TO 'prom'@'localhost';
創建.my.cnf文件并運行mysqld_exporter:
$ cd /opt/prometheus/prometheus_exporters
$
$ cat  EOF > .my.cnf
[client]
user=prom
password=abc123
EOF
$
$ ./mysqld_exporter -config.my-cnf=".my.cnf"
INFO[0000] Starting mysqld_exporter (version=0.9.0, branch=master, revision=8400af20ccdbf6b5e0faa2c925c56c48cd78d70b) source=mysqld_exporter.go:432
INFO[0000] Build context (go=go1.6.3, user=root@2c131c66ca20, date=20160926-18:28:09) source=mysqld_exporter.go:433
INFO[0000] Listening on :9104 source=mysqld_exporter.go:451
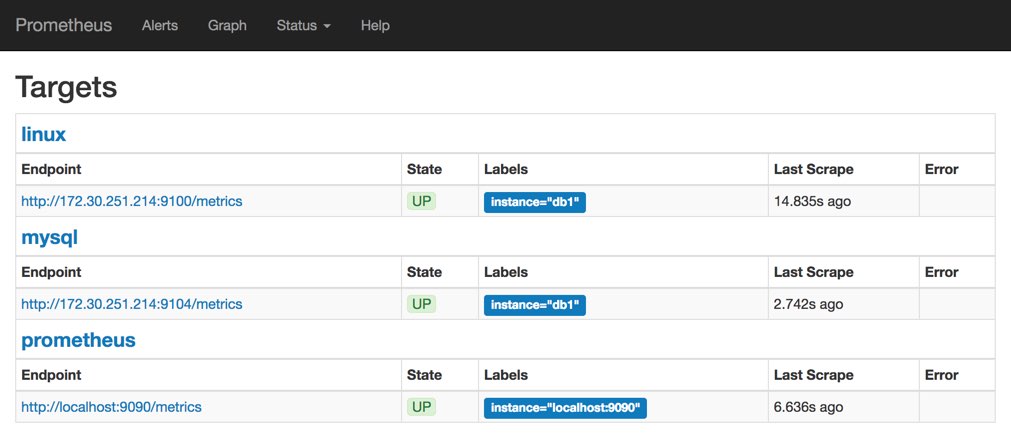
回到Prometheus web界面Status->Targets����,可以看到兩個Target的狀態已經變成UP了:
安裝和運行Grafana
安裝:
Grafana 的安裝官方文檔比較清晰��,這里不再贅述��。
配置:
編輯配置文件/etc/grafana/grafana.ini,修改dashboards.json段落下兩個參數的值:
[dashboards.json]
enabled = true
path = /var/lib/grafana/dashboards
導入Prometheus Dashboard:
$ git clone https://github.com/percona/grafana-dashboards.git
$ cp -r grafana-dashboards/dashboards /var/lib/grafana
啟動:
$ /etc/init.d/grafana-server start
通過http://monitor_host:3000訪問Grafana Web界面(缺省帳號/密碼為admin/admin)
登錄后,通過Data Sources頁面添加數據源:

然后就可以通過選擇不同的儀表盤(左上角)和時間段(右上角)來呈現圖表了:
System Overview:

MySQL Overview:

總結
以上就是這篇文章的全部內容了,希望本文的內容對大家的學習或者工作能帶來一定的幫助,如果有疑問大家可以留言交流����,謝謝大家對腳本之家的支持。
您可能感興趣的文章:- 使用Grafana+Prometheus監控mysql服務性能
- SpringBoot使用prometheus監控的示例代碼
- springboot2.X整合prometheus監控的實例講解
- SpringBoot+Prometheus+Grafana實現應用監控和報警的詳細步驟
- Prometheus的安裝和配置教程詳解
- Prometheus 入門教程之SpringBoot 實現自定義指標監控
- Prometheus開發中間件Exporter過程詳解
- springboot集成普羅米修斯(Prometheus)的方法
- 使用 prometheus python 庫編寫自定義指標的方法(完整代碼)
- 使用prometheus統計MySQL自增主鍵的剩余可用百分比
- 使用Prometheus+Grafana的方法監控Springboot應用教程詳解
- Prometheus 監控MySQL使用grafana展示